The 10 Safest Neighborhoods in LA, Measured Block by Block
By Sean Hingco, Founder, Saktoo
A top-10 ranking done rigorously: real block-level crime data rolled up to the neighborhood, plus every neighborhood's real pedestrian-collision record, kept as a separate signal. Sourced and dated.
Type "safest neighborhoods in LA" into any search box and you get a dozen ranked lists, almost all of them scoring a whole neighborhood with a single number, and almost none of them telling you where the number came from, what year it is, or what kind of safety it even measures. This is another one of those lists. The difference is in the last three things, and in the fact that we measure two very different kinds of safety instead of blending them into one authoritative-looking score.
The first is reported crime. The second is whether you can cross the street without being hit by a car, which in Los Angeles is not a small question. We rank on crime, because that is what people search for, but every neighborhood below also carries its real pedestrian-collision record, and as you will see, the two often disagree.
Safety, lens one: reported crime
Our crime signal counts five serious, consistently defined, mostly victim-reported offenses: homicide, robbery, aggravated assault, burglary, and motor vehicle theft. No drug offenses, no arrest-only records. Each incident is placed on a hexagonal cell about 320 meters across, smoothed to remove small-population noise, and ranked against every other covered block in LA and Orange County. Violent and property offenses are scored separately, shown below as V and P, each a 0 to 100 percentile where lower means less crime.
The full pipeline, including why we count those five offenses and no others and why we never reduce a neighborhood to a letter grade, is documented in how we measure safety without grading neighborhoods. The short version: crime concentrates block by block, so a neighborhood average is a blunt instrument. We use it here anyway, carefully, because a ranking is what this article is for, but the block-level view underneath is always the truer picture.
Safety, lens two: getting hit by a car
Ask renters about safety and they picture crime, but the risk they are statistically most likely to meet on a daily walk is traffic. Pedestrians are a small share of trips in LA and close to half of the people killed on its roads. We pulled every pedestrian-involved collision LAPD recorded from 2020 through early 2025, read each one's severity from the report codes, and mapped them the same way we map crime.
of pedestrian collisions
43%
sit on just the most collision-heavy 5% of LA blocks. Across the city, 785 people were killed and 2,576 severely injured while walking in that window. Like crime, this risk clusters on a handful of specific streets.
That pattern is baked into the road network. LA's own Vision Zero High Injury Network finds that about 6 percent of streets carry roughly 65 percent of the severe and fatal collisions. So we score pedestrian safety separately and then show it right next to crime, rather than dissolving both into one opaque grade. A neighborhood can be among the quietest in the city for crime and still be threaded by one of its worst boulevards to cross. Westwood is third-safest of all 102 neighborhoods for crime, yet its pedestrian record keeps it out of the top 10 entirely, as we will see.
Feel the two pull apart
Before the list, a quick way to feel the idea rather than just read it. Build a block below: set the street, how many people are on foot, and how much reported crime, and watch the two risk meters move on their own. There is no single dial for safety, because there is no single kind of safety.
Build a block
Change the environment and watch the two kinds of safety respond. They are modeled differently, and they do not move together.
A pedestrian's odds of dying climb steeply with impact speed, so the street decides walking danger far more than crime does.
More people about, lit and cared-for, means more natural surveillance, which criminology says drops the opportunity for crime.
Drag foot trafficalone and watch the asymmetry: it barely nudges pedestrian risk, but it drops crime risk sharply, because the same people who add a little exposure add a lot of “eyes on the street.” One lever, two very different effects. That is why the two are scored on their own axes and then shown side by side, never hidden inside one grade.
One honest caveat before the list
A safety ranking like this leans, predictably, toward wealthier and quieter parts of the city. That is not an accident of our method; it is a fact about how reported crime, historic disinvestment, and income are entangled in Los Angeles, and no amount of statistical smoothing changes it. We do not adjust the numbers to correct for it, because inventing a correction would be its own kind of dishonesty. What we do instead is keep the two kinds of risk visible and separate inside the score, so it is never one opaque grade, and point you at the block-level tool, so the takeaway is never just "move somewhere expensive."
The 10 safest LA neighborhoods, ranked
Here is the calculation. Each neighborhood gets a crime score and a pedestrian score, both on the same 0 to 100 scale where lower is safer: the crime score is how it ranks against every block in the region, the pedestrian score is how its collision record ranks against every other neighborhood in the city. The two stack into one bar, so the total length is the combined risk and the order below is simply shortest bar first. Because both parts count, a place can be near-spotless on crime and still slide down the list on the strength of its pedestrian record. That is exactly what happens to Westwood.
A walk through all ten
The ranking in one bar is tidy; on the ground each place is more specific. Here is the tour, safest first, one neighborhood at a time, with where its crime tends to concentrate and what makes its streets easier or harder to walk. As you arrive at each stop, the street network lights up and every pedestrian collision drops onto the map as a dot, darkest where it was fatal. Watch them line up along the fast corridors.
Each dot is a pedestrian-involved collision, 2020 through early 2025: amber for an injury, orange for a severe one, dark red for a fatal one. They cluster on the fast corridors. Crime percentiles from the Saktoo safety pipeline; collisions from LAPD traffic-collision records; street network and boundaries from the Saktoo map.
Three you might expect, and why they miss
A crime-only ranking would put all three of these near the top, and plenty of "safest LA" lists do exactly that. They land far lower here because the pedestrian half of the score is honest about their streets.
Westwood, 24th of the 102. Third-safest in the whole city for crime, and yet its 68 pedestrian collisions around UCLA, 21 of them severe, are the most of any neighborhood on this page. Calm to live in, genuinely hard to cross on foot.
Tujunga, 16th. Below the regional average for crime, but undone by 22 collisions with three fatal and ten severe, nearly all funneled onto Foothill Boulevard.
Shadow Hills, 14th. Semi-rural and almost crime-free, yet its fast, sidewalk-less roads produced 21 collisions, three of them fatal.
None of this makes them bad places to live. It makes them places where a crime map would tell you one thing and the crosswalk another, which is the whole reason we score both.
The pattern nobody puts on these lists
Line up all 99 scorable LA neighborhoods by how walkable their street design is, and an uncomfortable trend appears: the safest neighborhoods are, on the whole, the least walkable. The most car-oriented third of the city averages a combined score of about 38; the most walkable third averages about 64. Population density tracks it even more tightly, at a correlation of 0.6.
Some of that is real: quieter, lower-density, higher-income areas genuinely see less reported crime. But a large part is an artifact worth naming out loud. A neighborhood where almost no one walks records almost no pedestrian collisions, and the score reads that as safe. Beverly Crest and Lake View Terrace sit near the top partly because their streets are barely walked at all, which is not the same as being safe to walk.
So the honest reading is a tension, not a verdict. The very features that make a neighborhood score safest here, low density and few people on foot, are the ones a modern planner would call car-dependent and set out to change. A place that is safe and walkable at once, low crime with slow, well-crossed streets full of people, is the harder thing to build, and rarer on this map than either half alone.
So, what is the safest neighborhood in LA?
The honest answer is that it depends on which risk you mean, and the two do not line up. Beverly Crest tops the list but is a place almost no one walks. Westwood is calm for crime yet so hard to cross that it misses the top 10 altogether. The most useful thing a ranking like this can do is refuse to collapse those into one number and instead show you both, plainly, so you can weigh the one that actually matters for how you live.
And even then, a neighborhood is the wrong unit. Every place on this list holds busier blocks and calmer ones, and a few blocks in neighborhoods that did not make it will beat everything here. A ranking cannot tell you that; an address can. Drop in the specific place you are weighing and you get both signals for its block rather than its neighborhood's average, alongside the five other things that decide whether a place actually fits your life.
How we did this
Two datasets, two calculations, combined only at the very end. For crime, we place every serious incident on a hexagonal cell about 320 meters across, rank each cell against every covered block in LA and Orange County, and roll the cells up to each neighborhood as a population-weighted blend of its violent and property percentiles (weighted 60/40, since violent crime weighs heavier on how a place feels). For pedestrians, we counted every pedestrian-involved collision, weighted the fatal and severe ones more heavily, and ranked each neighborhood's total against every other in the city. Both come out as a 0 to 100 score where lower is safer, and the ranking is simply their average, with the stacked bar always showing the split so nothing hides inside the total. Neither number is adjusted after the fact. Full sources and dates:
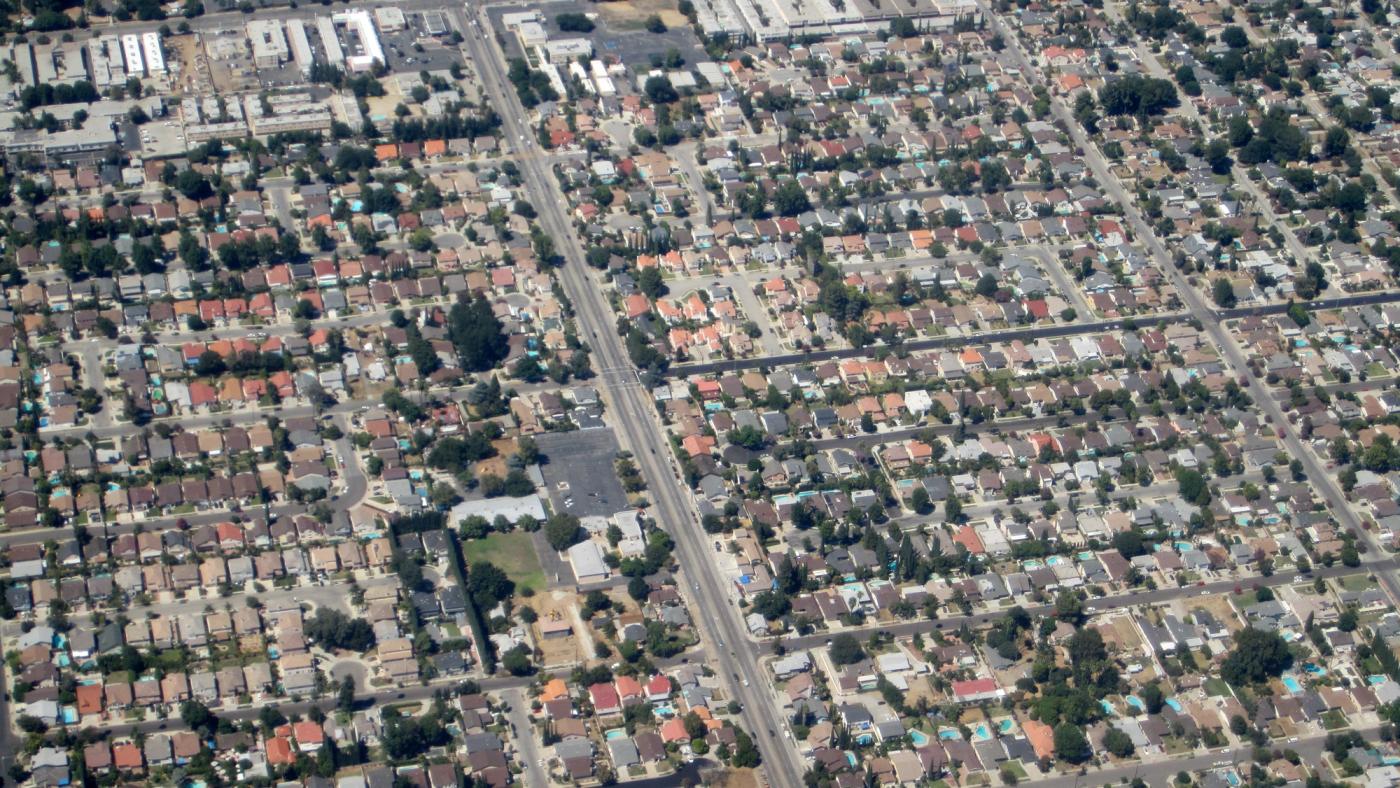
Reported crime: LAPD public data, LA County Sheriff Part I and II crimes, and California DOJ OpenJustice agency counts, trailing three years, documented in full in our safety methodology article. Neighborhood rankings are a population-weighted blend of violent and property percentiles across each City of LA neighborhood's hexes, computed August 2026. Pedestrian collisions: LAPD Traffic Collision Data, every pedestrian-involved collision (MO code 3003) from January 2020 through the dataset's current extent in early 2025, with severity read from the report's KABCO codes and weighted toward fatal and severe outcomes. A statewide upgrade using SWITRS via UC Berkeley TIMS is in progress; it will extend the pedestrian data to Orange County and a longer window. The Vision Zero concentration figure is from LA's High Injury Network. If you spot an error, tell us and we will check it. Cover photo of a Los Angeles residential neighborhood by La Citta Vita, licensed CC BY-SA 2.0 via Wikimedia Commons.
Safety is one of six things Saktoo scores for, alongside rent, space, commute, environment, and daily-life amenities. Take the quiz to see how the specific places you are weighing score across all of them, at the block level, with every number sourced.
Sean Hingco, Founder, Saktoo
Sean Hingco built and maintains Saktoo, which scores 7,644 neighborhoods across Los Angeles and Orange County on census, school, crime and environmental data. He writes the methodology behind every ranking here and publishes the underlying figures so they can be checked.
More about the person behind Saktoo →